- Click here for Part 1 -
A 68-year-old male was referred to the two-week wait prostatic clinic with a serum prostate specific antigen (PSA) of 17. He had no bothersome lower urinary tract symptoms, relevant past medical history or family history of prostate cancer. The figures show his multiparametric MRI scan (mp-MRI) conducted in accordance with European Association of Urology (EAU) and National Institute for Health & Care Excellence (NICE) guidelines.

Figure 1.

Figure 2.

Figure 3.

Figure 4.

Figure 5.
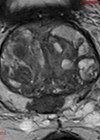
- What are the MRI sequences on the right (Figures 1-4) and what do they show?
- The patient’s mp-MRI showed a 50cc prostate gland. His PSA density was calculated to be elevated at 0.34. Based on his PSA and MRI findings, he underwent transperineal prostate biopsies using ultrasound guidance. What does the histology in Figure 5 show?
- The patient’s case was discussed in the multidisciplinary team meeting. His prostate cancer was confirmed to fulfil criteria within EAU’s high risk prostate cancer category. What are the risk stratification categories for prostate cancer?
- Being high risk, the patient underwent further imaging to check for metastases in the form of CT chest, abdomen and pelvis (for lymph node metastases), and a bone scan (for skeletal metastases). What is the sensitivity and specificity of these imaging modalities?
Answers
1. Figure 1 is an axial T2 weighted MRI image. It shows an abnormal 3cm lesion in the mid-gland of the right peripheral zone, between 6 o’clock and 8 o’clock. It would be considered T2 N0 M0. Prostate cancer appears dark on T2 weighted imaging [1].
Figure 2 is the diffusion weighted imaging (DWI). DWI refers to how easily water diffuses across the cells. The diffusion of water is impeded by the increase in number of cells and the tumour matrix (i.e. restricted diffusion). Therefore, cancer cells lead to increased restricted diffusion. This lesion would be considered Prostate Imaging Reporting & Data System (PIRADS) 5.
Figure 3 is the apparent diffusion coefficient (ADC) sequence. Using complex equations, ADC is derived from DWI. Prostate cancer appears dark on ADC sequence as seen here.
Figure 4 is the dynamic contrast enhancement (DCE) sequence post injection of IV gadolinium. Tumour neogenesis causes contrast stasis in tumour regions and appear as enhancement. Prostate cancer therefore appears brighter on DCE, as seen in the right peripheral zone.

Figure 5.
2. Figure 5 shows a haematoxylin and eosin core biopsy of the prostate. Adenocarcinoma of the prostate is highlighted within the circle on the image, with single cords and poorly formed glands lacking a basal cell layer. This contrasts with benign prostatic acini which consist of a luminal cell layer surrounded by a basal cell layer. At high power, the tumour cells are seen to be enlarged with variably sized and shaped (pleomorphic) nuclei and prominent nucleoli (white arrow). They are arranged predominantly in cords (black arrow) and show minimal glandular differentiation (intracytoplasmic vacuoles). This arrangement of tumour cells is classified as Gleason 5 growth pattern.
3. EAU stratify risk based on risk for metastases, biochemical recurrence of localised and locally advanced prostate cancer, as in the table [2].
4. Reference ranges vary for exact specificity and sensitivity. However, it is generally accepted that sensitivity and specificity for lymph nodes on CT is 42% and 82%, respectively. For bone scan, the sensitivity and specificity for bone metastases is 79% and 82%, respectively [3,4].

References
1. Sultana A, Tam H, Ahmed HU, Leung LY. Prostate cancer series: diagnostics 1. Urology News 2025;29(2):17–18.
2. Cornford P, Tilki D, Van Den Bergh RCN, et al. EAU Guidelines on Prostate Cancer 2024. Chapter 4: Classification and staging systems. EAU Guidelines Office; Arnhem, The Netherlands; 2024.
https://uroweb.org/guidelines/prostate-cancer/
chapter/classification-and-staging-systems
[Last accessed 5 February 2025].
3. Hövels AM, Heesakkers RAM, Adang EM, et al. The diagnostic accuracy of CT and MRI in the staging of pelvic lymph nodes in patients with prostate cancer: A meta-analysis. Clinical Radiology 2008;63(4):387–95.
4. Shen G, Deng H, Hu S, Jia Z. Comparison of choline-PET/CT, MRI, SPECT, and bone scintigraphy in the diagnosis of bone metastases in patients with prostate cancer: a meta-analysis. Skeletal Radiology 2014;43(11):1503–13.